Review: Emissions / Energy Consumption
-
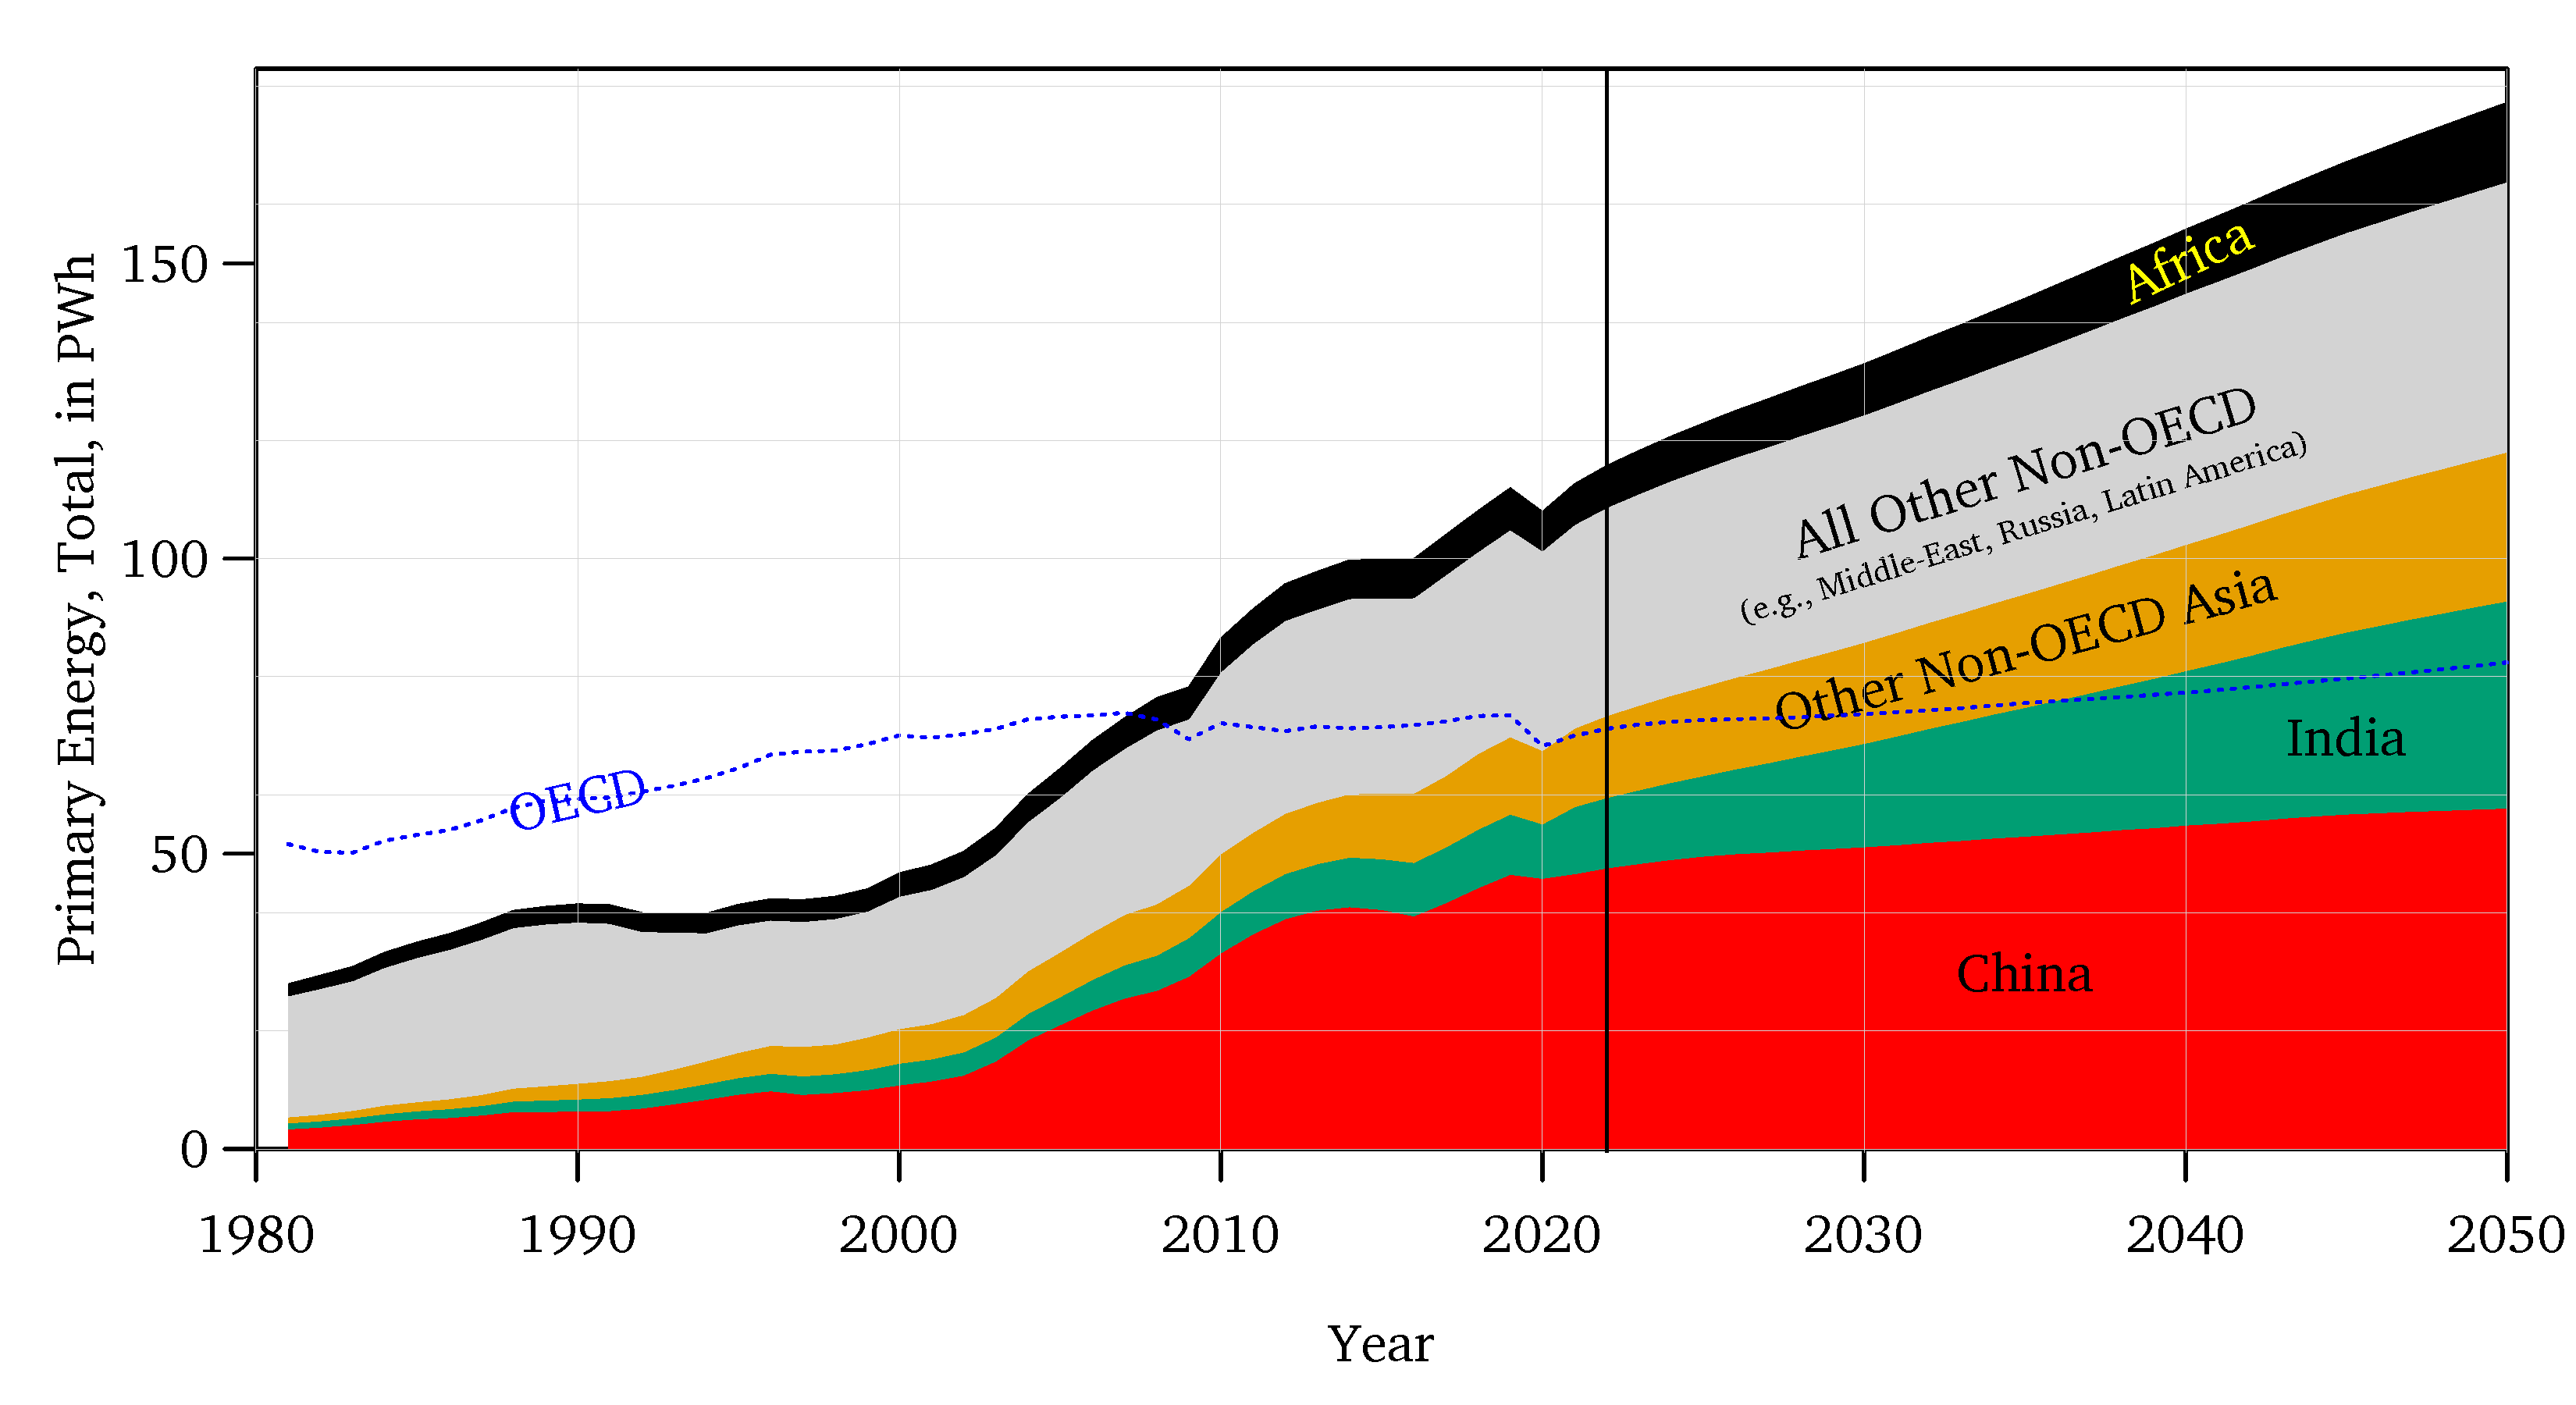
world energy use is growing,
-
greatly population and wealth related, and
-
no longer primarily an oecd issue.
-
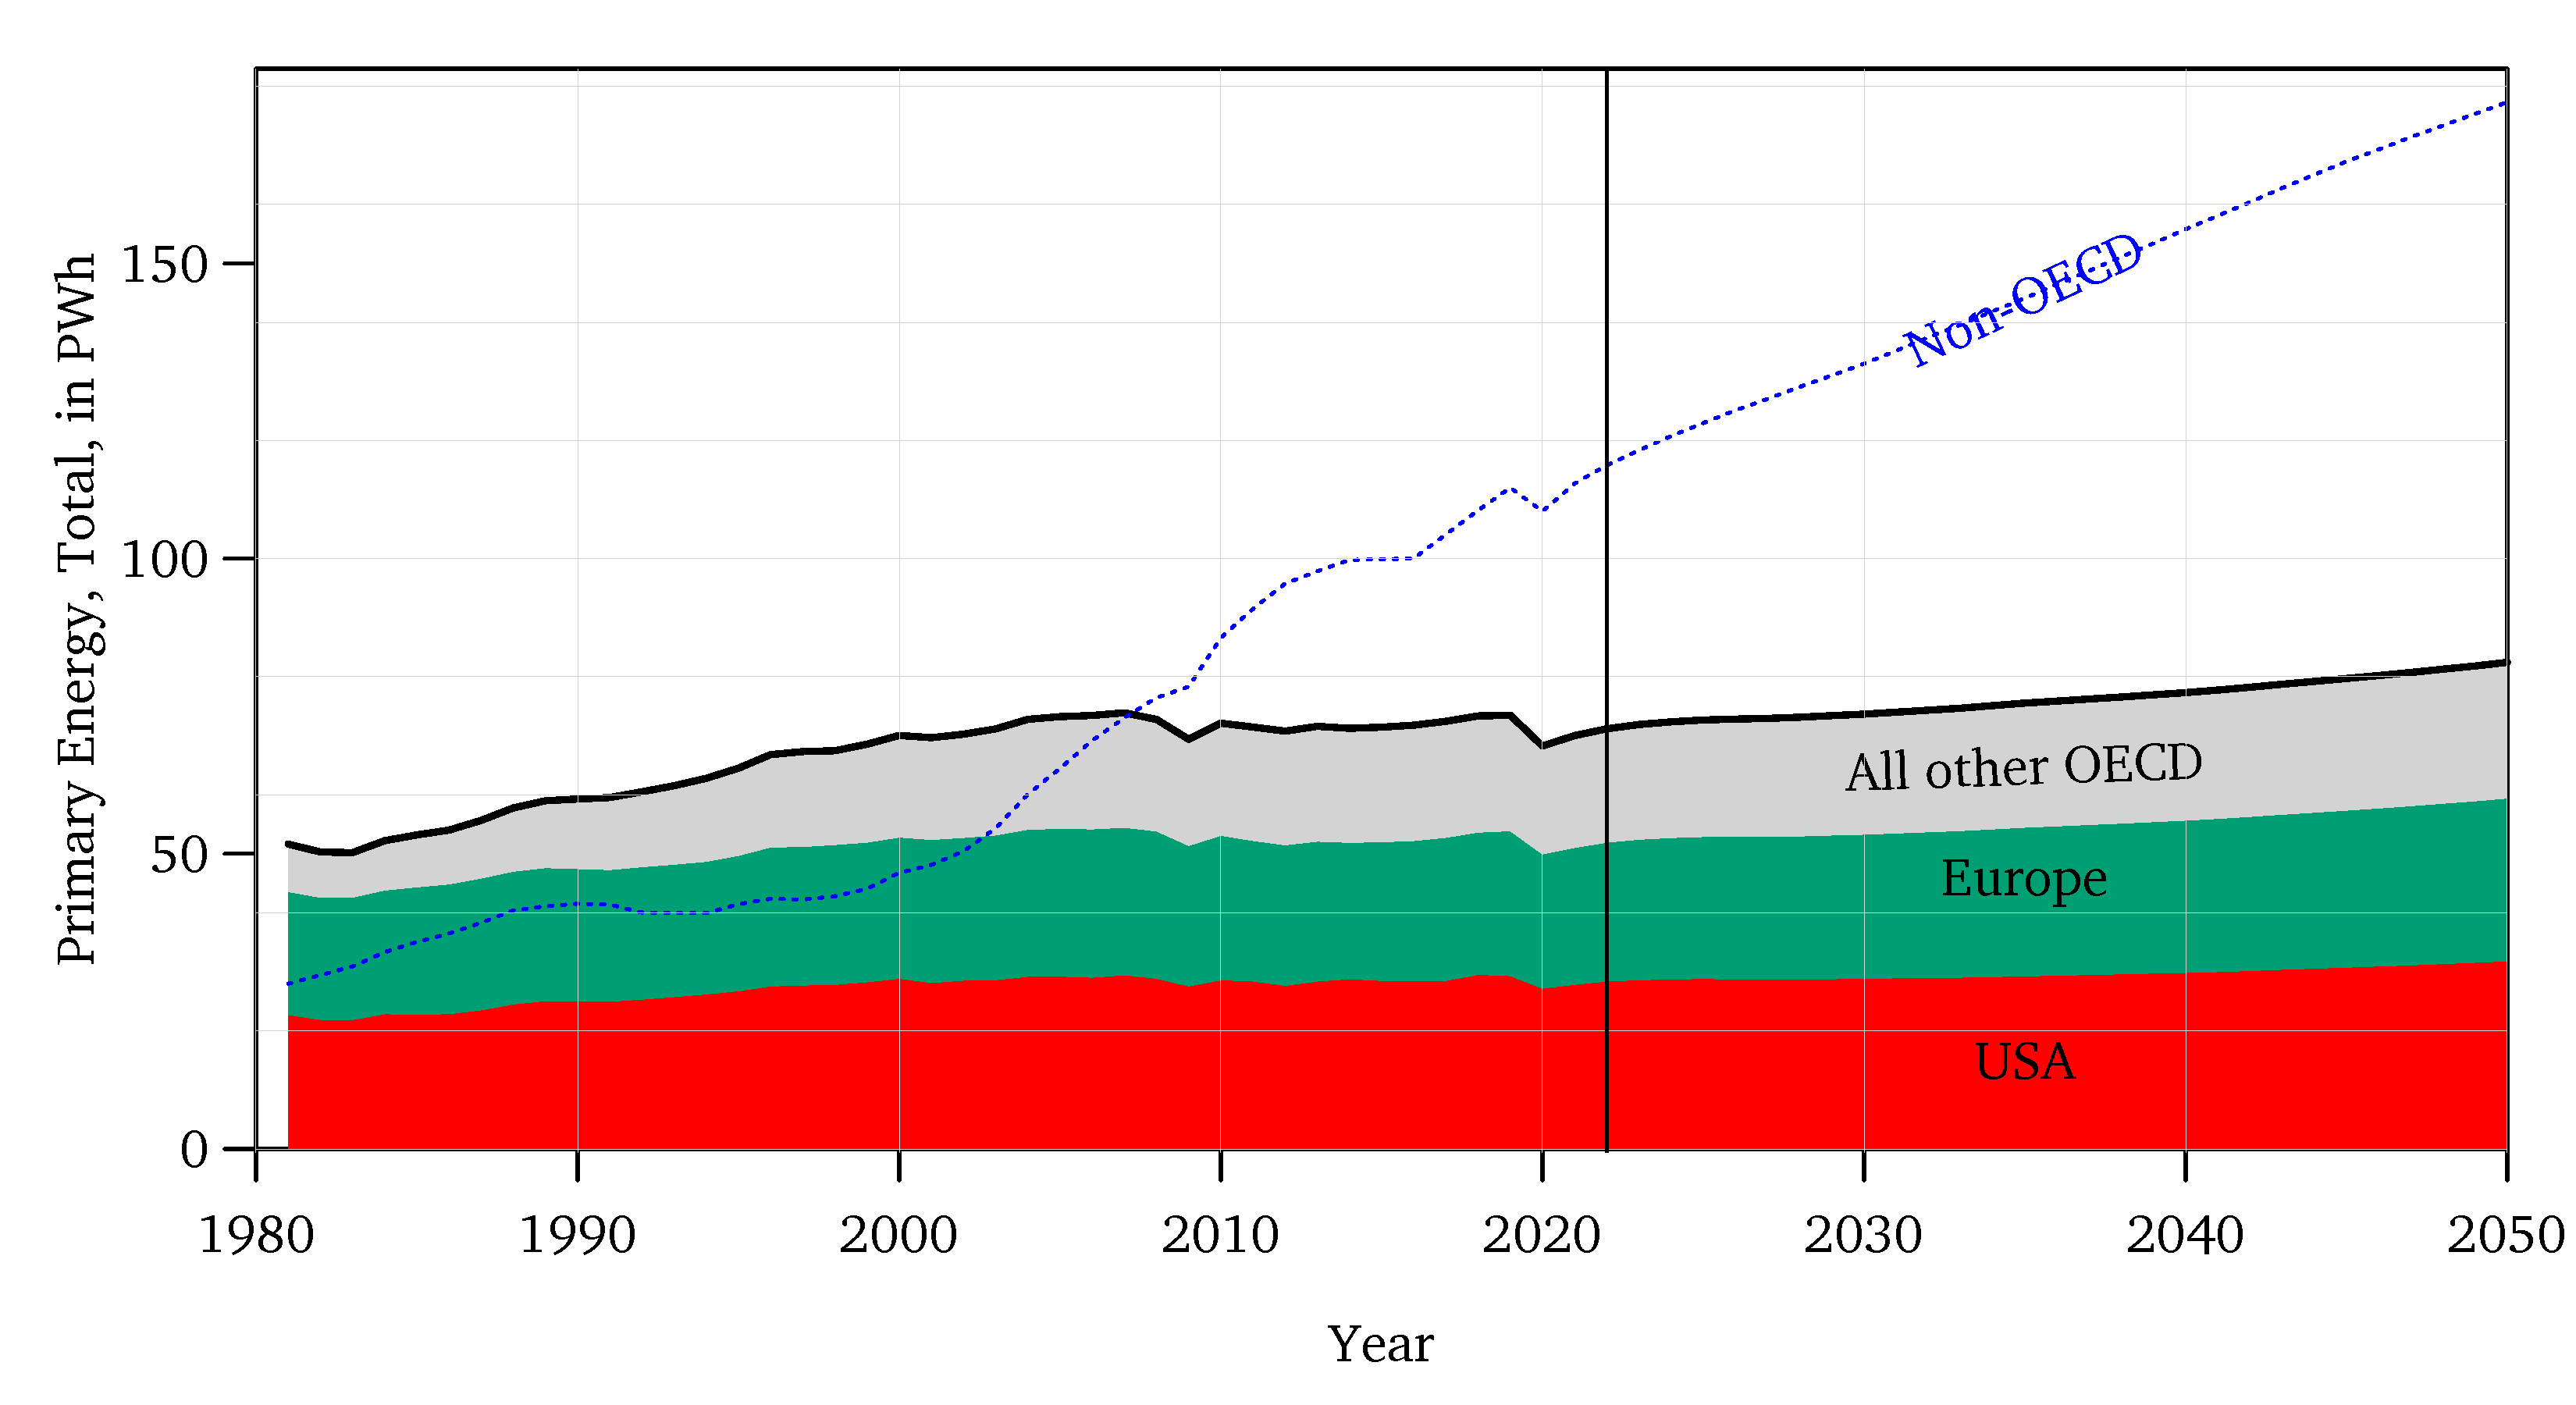
oecd is already distinctly < 50%,
-
and stable or declining.
-
soon, oecd will be 25%.
-
-
-
growth now mostly among 7-9 billion people in mid- and low-income countries.
Energy To Emissions
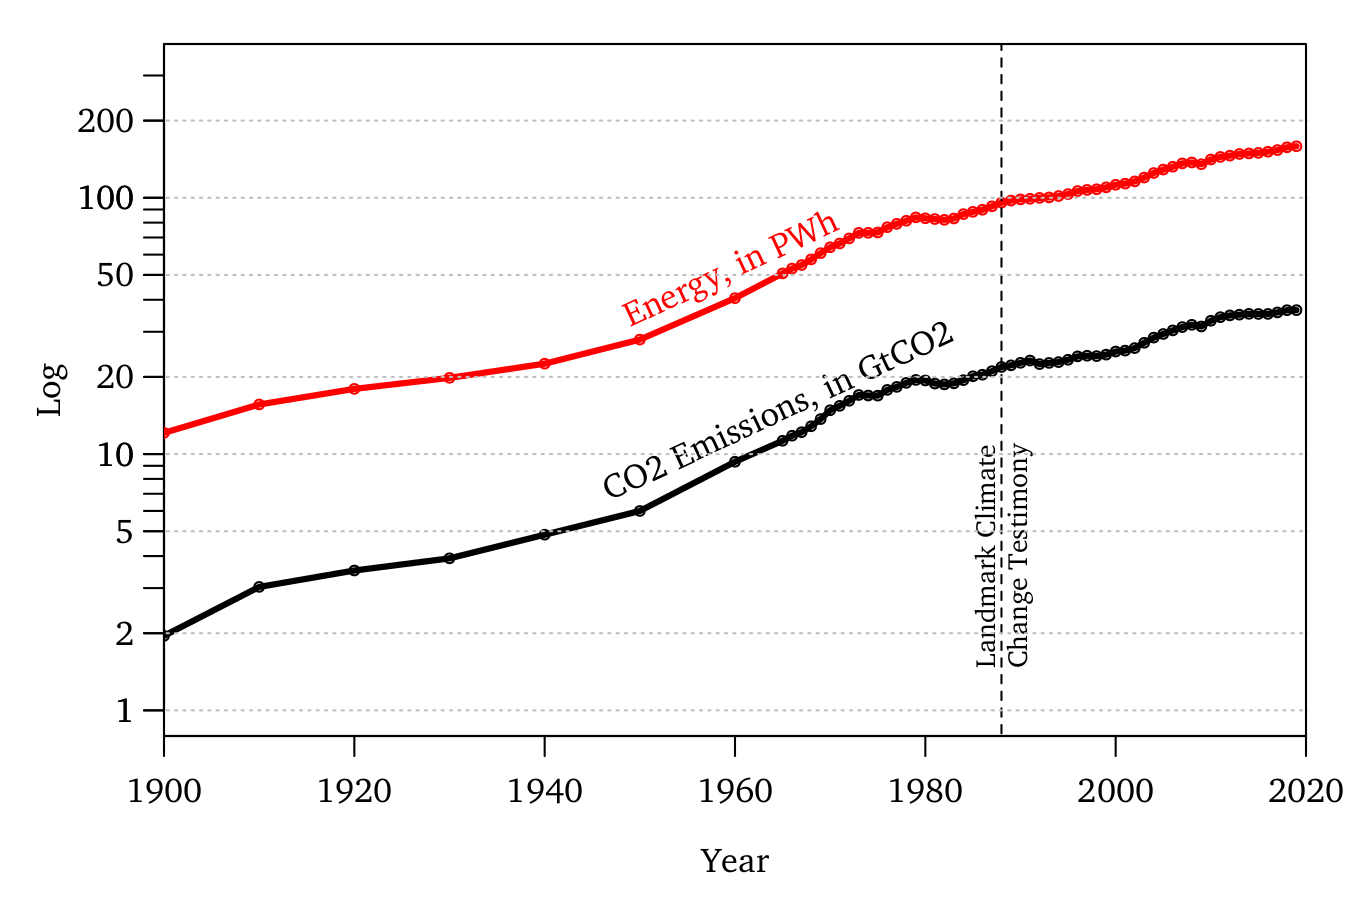
Energy To Emissions Relationship
-
Basically one-to-one correspondence.
-
Think Chapter 1 and you won’t be far off.
- Non-energy emissions also correlate with energy use.
The Power Of Activism
-
Has activism made much difference?
-
Has it broken the link between energy and emissions? Slowed emissions?
-
You tell me!
-
Causation causes correlation, not vice-versa.
-
Lying with statistics: The rooster did not raise the sun. Yes, climate activism mattered: energy 1960s growth rate > 2000s. Both slowed in the mid-1970s already.
Global Climate Change (GCC)
-
Just one consequence (climate change),
-
of just one consequence (emissions),
-
of mostly one consequence (75\% energy),
- 75% of GHGs are from energy provision.
-
of humanity’s huge population.
- Emissions are $\approx$ 1-to-1 with energy
Climate change is not intentional. It’s a “unintended side effect.”
-
Exactly how do you plan to address these problems?
-
Four possible jammers:
-
Population
-
Energy use
-
Emissions
-
Climate Change
Total Primary Energy Use
Total Primary Energy Use
Warning
-
This is not the fault of non-OECD countries.
-
Fault is futile and irrelevant.
-
It’s not about guilt or innocence.
-
It’s about reality.
-
It’s about what it takes to reduce power (and emissions).
2050e (B, Kwh, Pwh)
| Area | Pop | pCpD | Total |
|---|---|---|---|
| OECD | 1.5 | 150 | 80 |
| USA | 0.4 | 220 | 32 |
| Non-OECD | 8.2 | 60 | 180 |
| China | 1.4 | 110 | 60 |
| India | 1.6 | 60 | 35 |
| World | 9.7 | 75 | 260 |
Per Capita
-
Rough consumption of Energy:
-
1 Part driving (13 MWh/year)
-
1 Part flying (10 MWh/year from LA to Europe)
-
1 Part heating and cooling
-
1 Part everything else
-
What will the average American happily give up?
- PS: Today, only 1/3 is electricity. Soon: 2/3.
Solutions Must Scale
Watch this Youtube: Tesla as a solution to our energy!
Per Person Per Day (Pppd)
Stable:
-
Americans are “worst,” at 200 KWh pPpD.
-
European living standard is high, at 120 KWh pPpD.
Growing:
-
China is 80 KWh pPpD. Only medium-rich yet.
- but already emits more than US pPpD (coal).
-
India / Africa, still on subsistence poverty.
Skip Efficiency
-
Efficiency is slowly creeping up everywhere.
-
The world produces more with less energy,
-
… plus, same energy emits less.
-
But efficiency progress is not enough.
-
In total, human energy use and emissions are still not just growing but accelerating.
Efficiency Per GDP: Omitted
-
Low in China, India, Arabia, Korea.
-
High in Africa, Brazil, Germany, Sweden.
(But countries do different things.)
Where Is The World Going?
-
Predict Population
-
Predict Energy Use Per Person
-
consider efficiency gains
-
assume only historical patterns.
-
Balloney?
What about the clean energy revolution?
Clean Energy Revolution?

Get It Now?
-
If the world could restrain energy use to today, it would be a huge accomplishment,
-
… and yet it would not be enough.
This is the basic problem of civilization today.
It’s not hopeless. There are things that you and the world can do, but not necessarily what you read in the media.
Presumably, this is why you are taking this course.