Ivo Welch
December 31, 2021
OECD: Rich
Not OECD: Not Rich (Mid-Income or Poor)
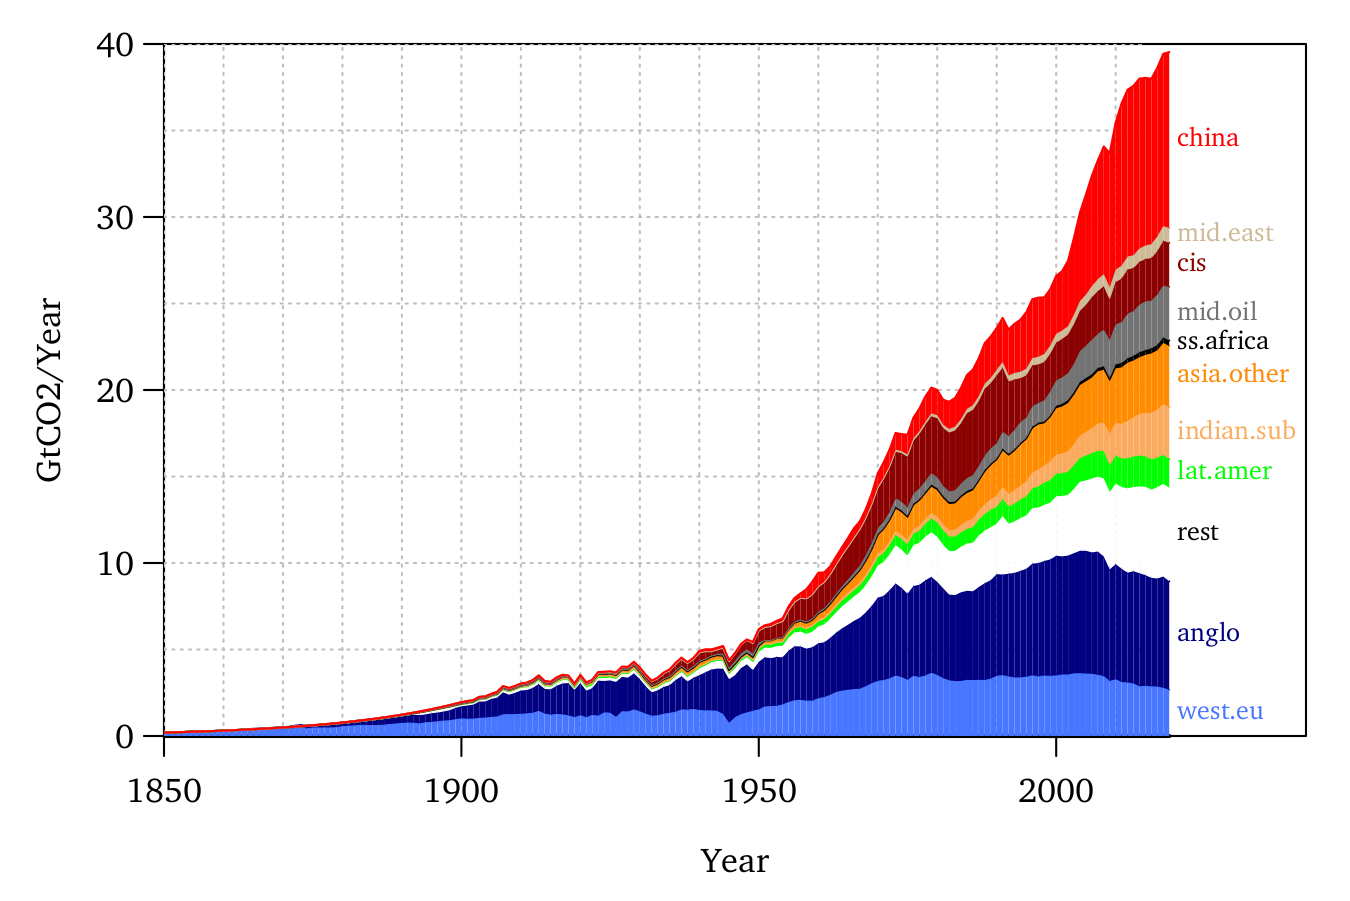
Emissions no longer primarily OECD / US problem.
Most important emitter now China +.
Principal emissions growth now India and developing world.
If non-OECD countries don’t clean up their acts, too, the world will emit a lot more GHGs sooner than later.
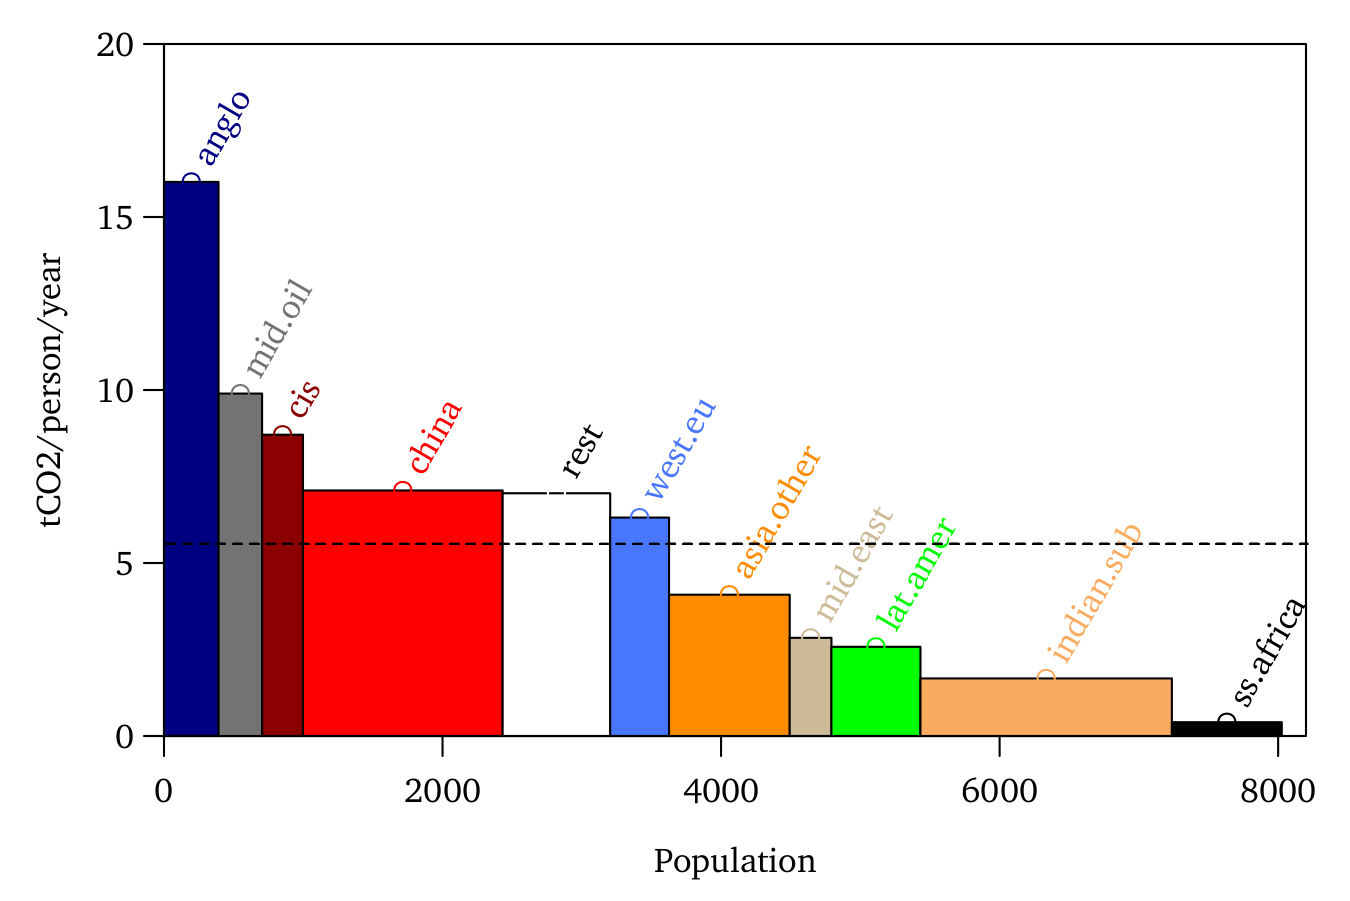
| Area | Pop | pCpD | Total | Emi |
|---|---|---|---|---|
| OECD | 1.5 | 150 | 80 | 12 |
| USA | 0.4 | 220 | 32 | 5 |
| Non-OECD | 8.2 | 60 | 180 | 31 |
| China | 1.4 | 110 | 60 | 11 |
| India | 1.6 | 60 | 35 | 6 |
| World | 9.7 | 75 | 260 | 43 |
There will be no contrition transfers!
… but morbid fun.
See next pages for cumulative “responsibility”

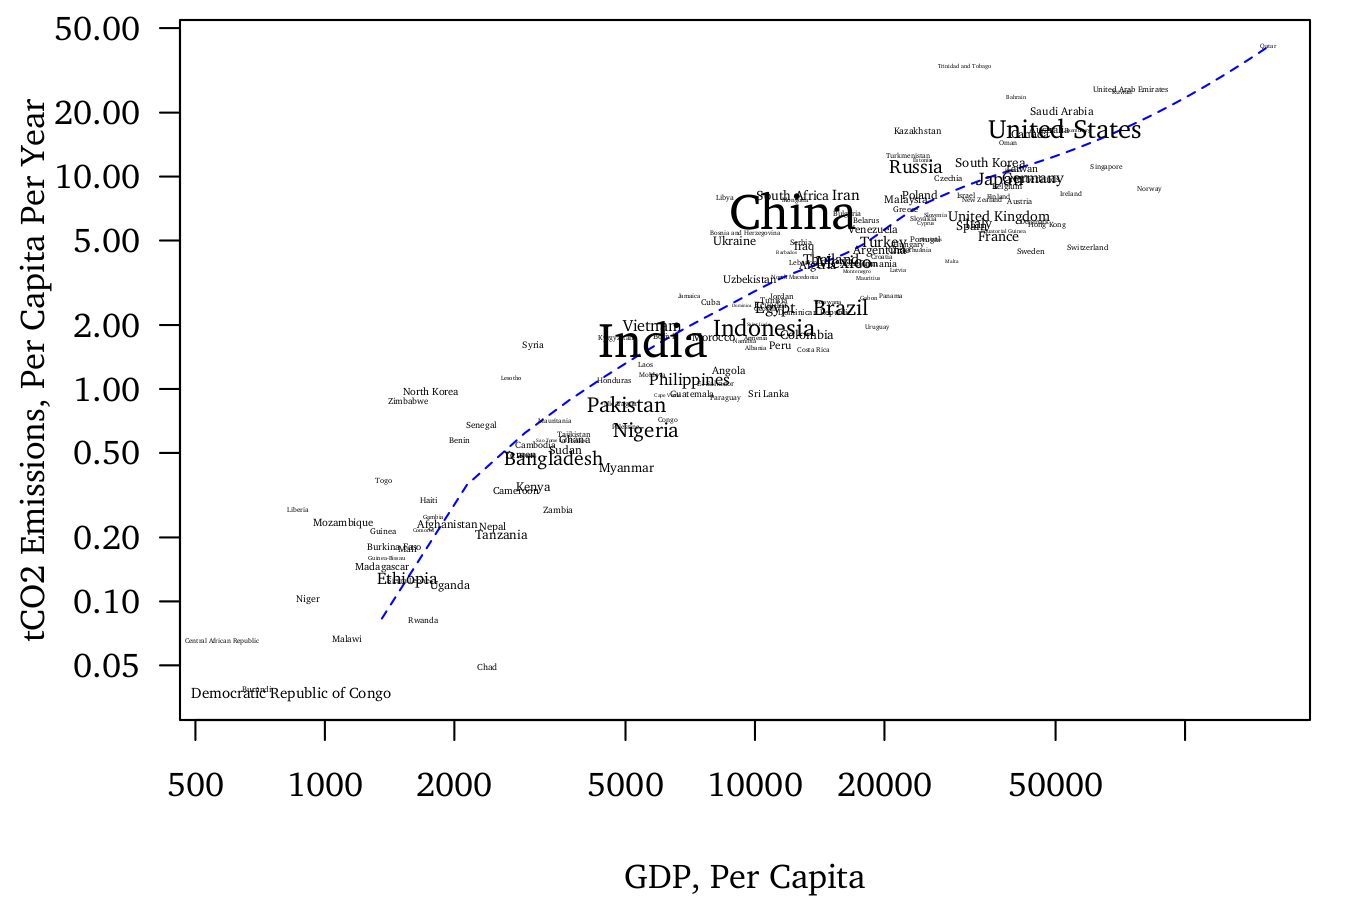
Lower or higher emissions?
Where will poor countries want to go?
Where will poor countries go?
Does it matter what you think?
Does it matter whether Biden likes it?
Does it matter whether the EU or UN likes it?
💊